Linear Regression (Statistics Final Project)
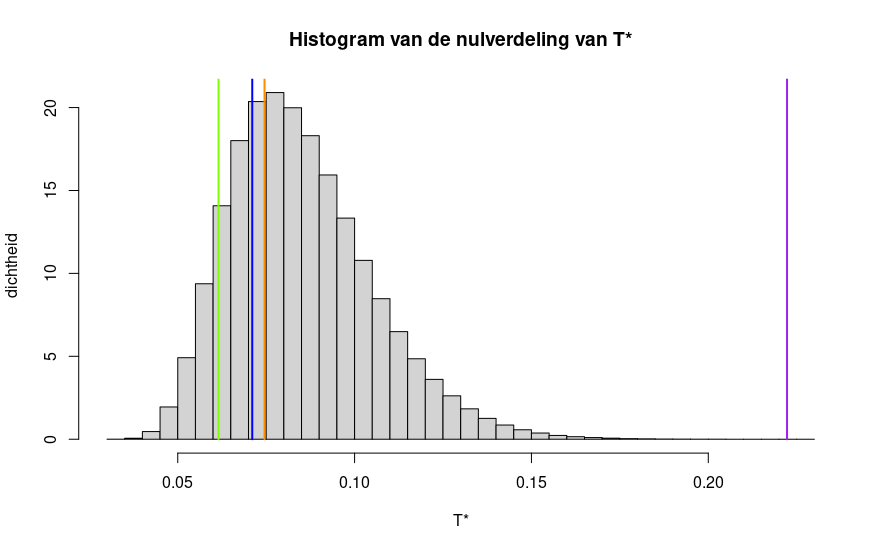
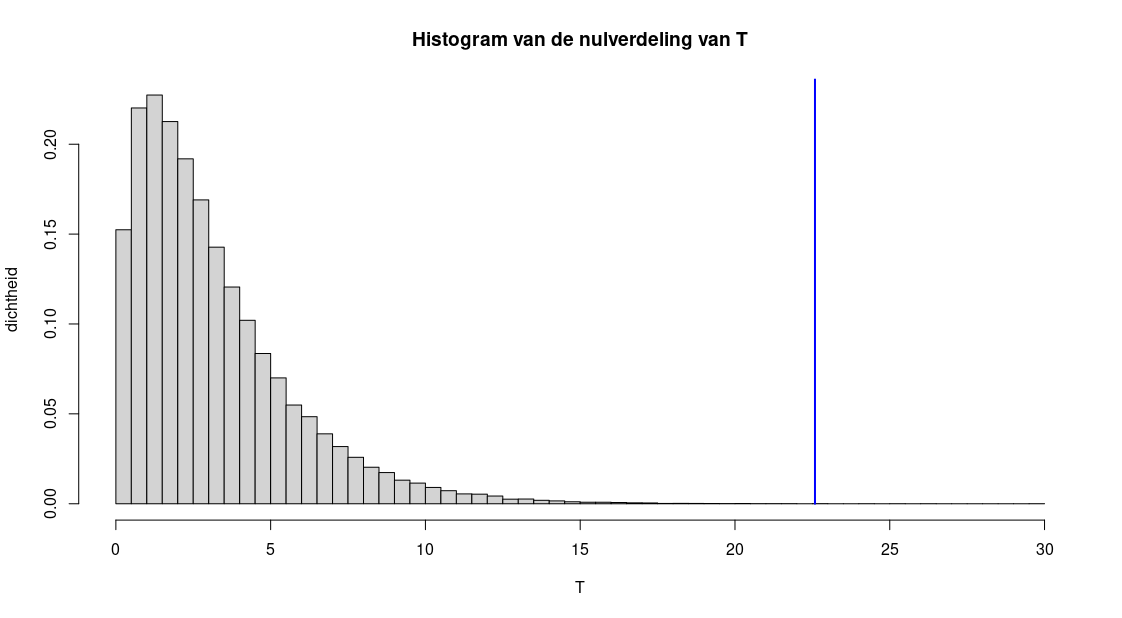
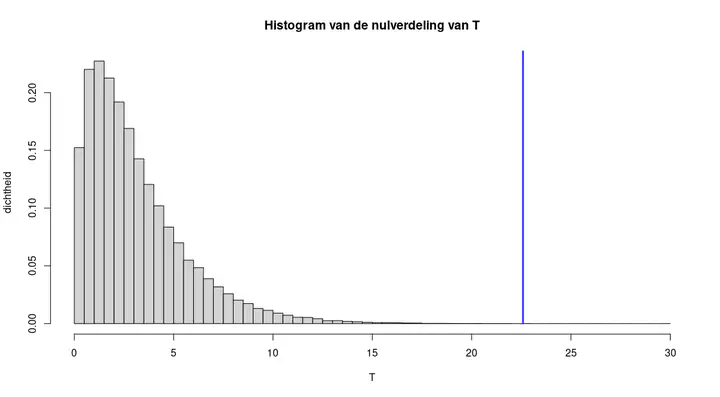 Histogram of a simulated KS-test-statistic to test for normality of the residuals. Visualizes the Liliefors-test.
Availability
The repository with report and R scripts is publicly available on Github
Outline of the Project
(Project Report and R script written in Dutch) A final project about regression analysis I did as part of the course Statistics.
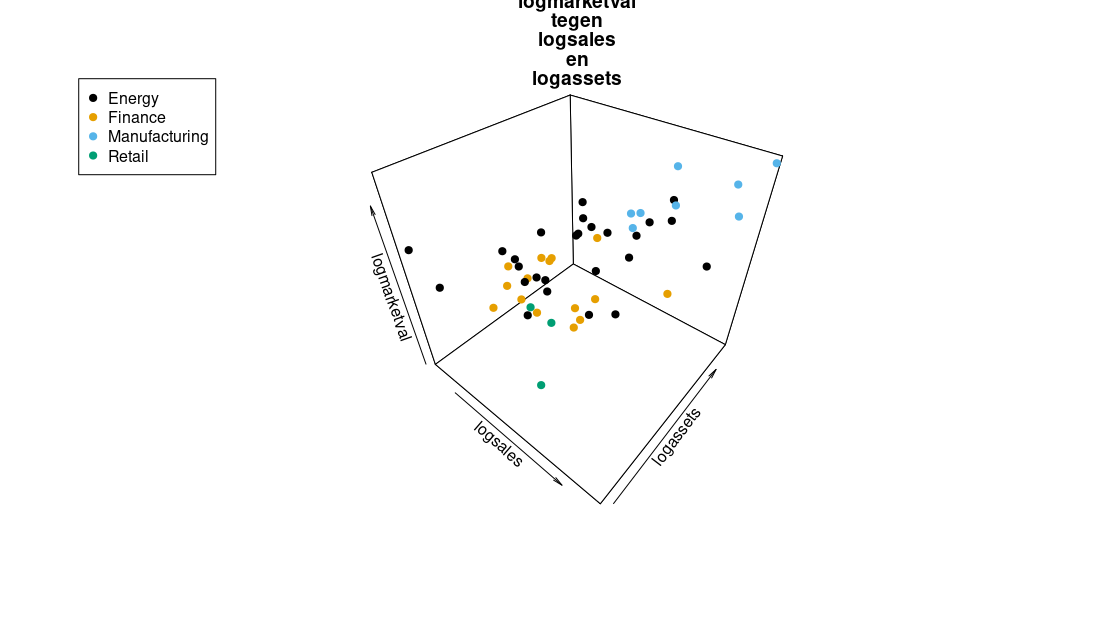
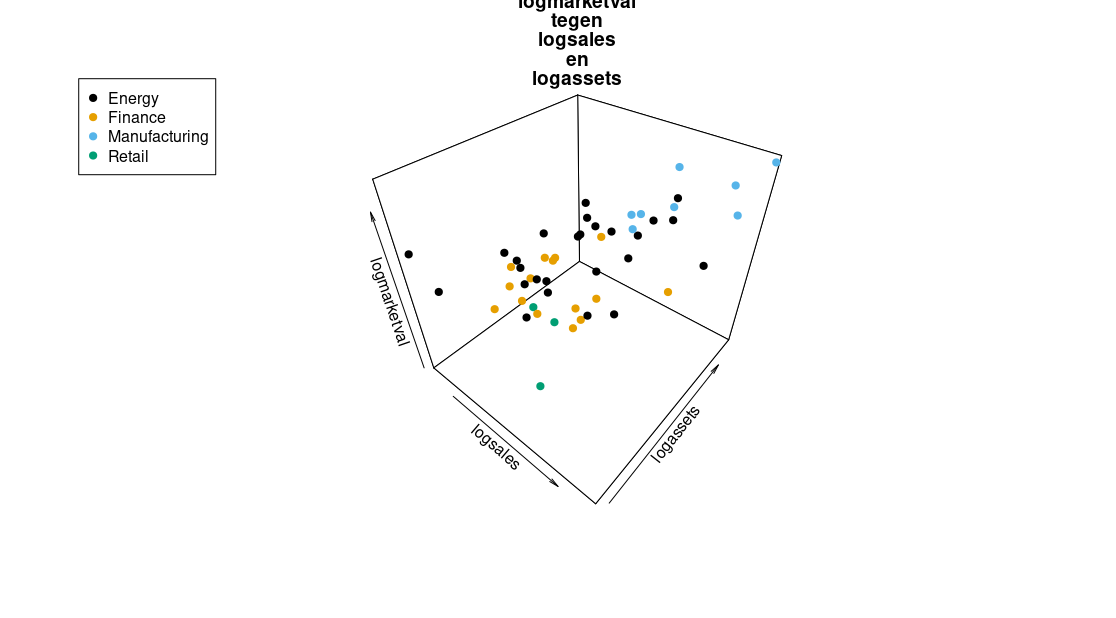
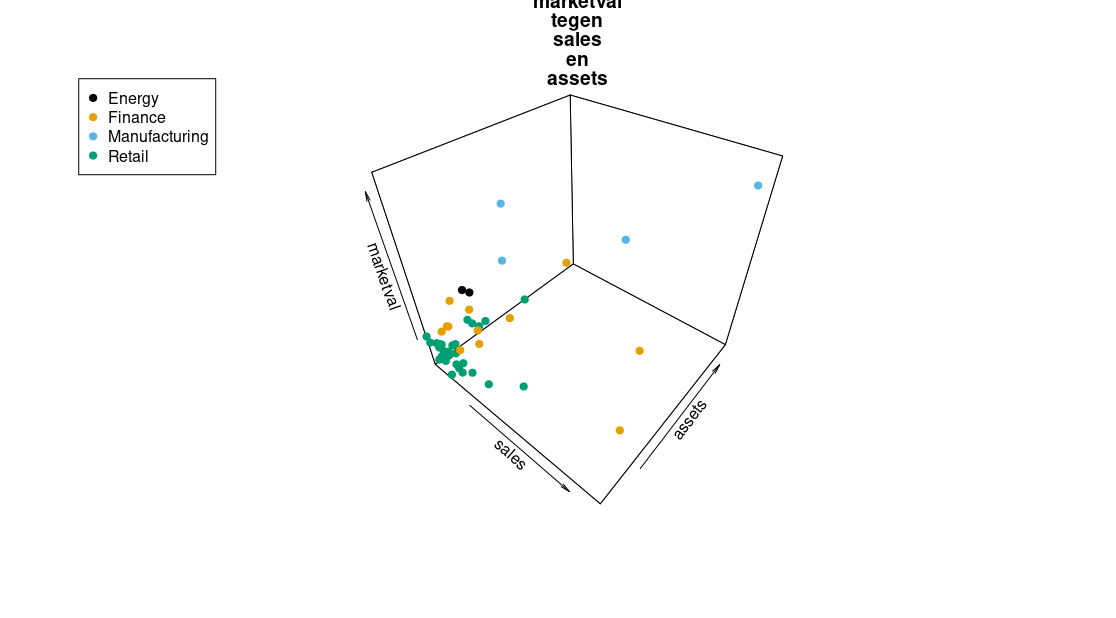
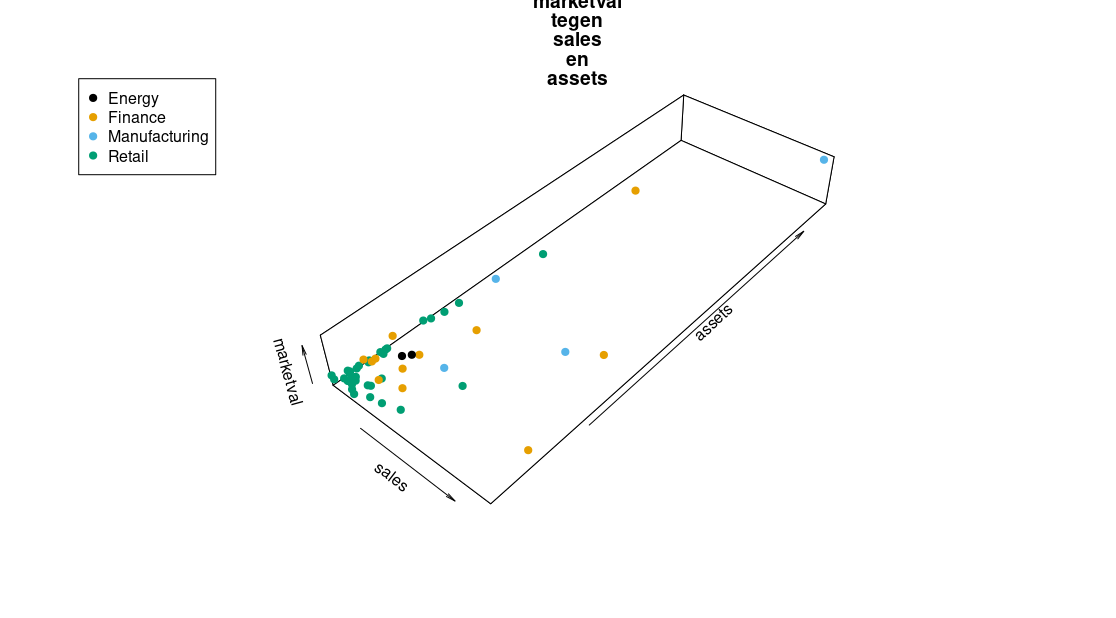
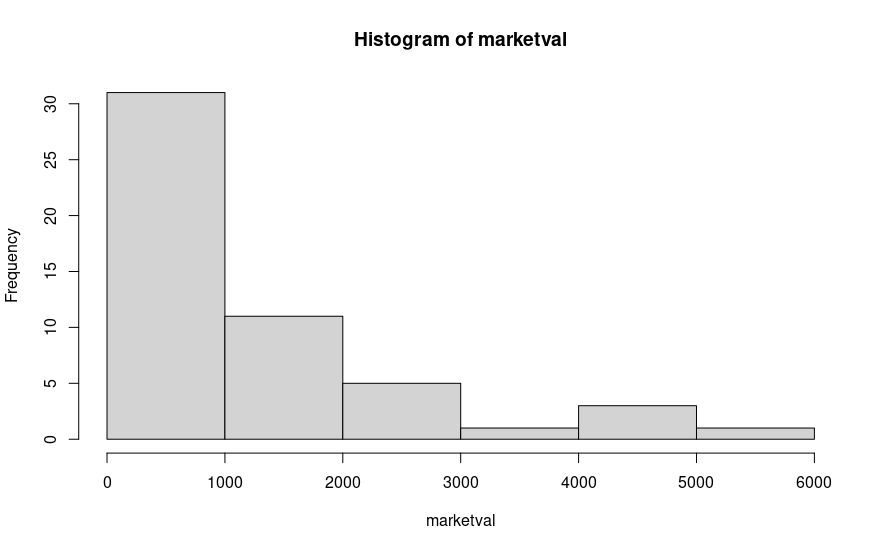
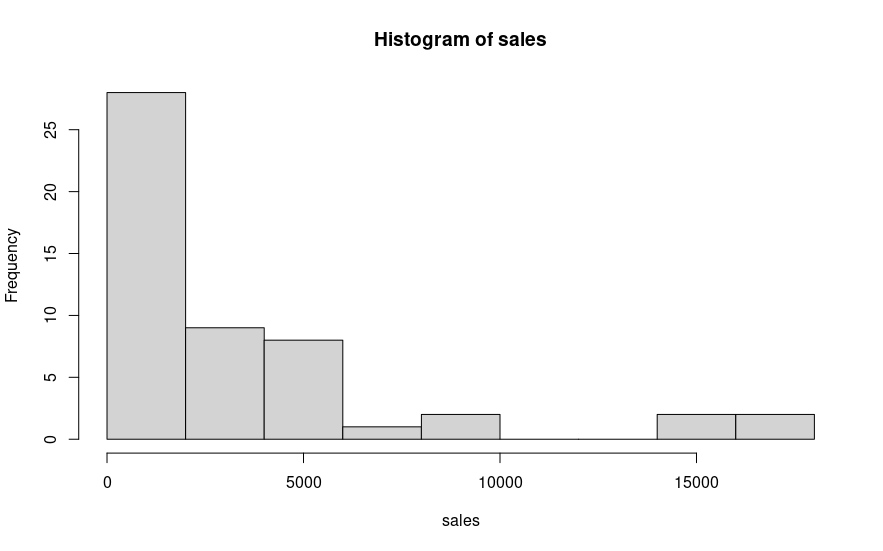
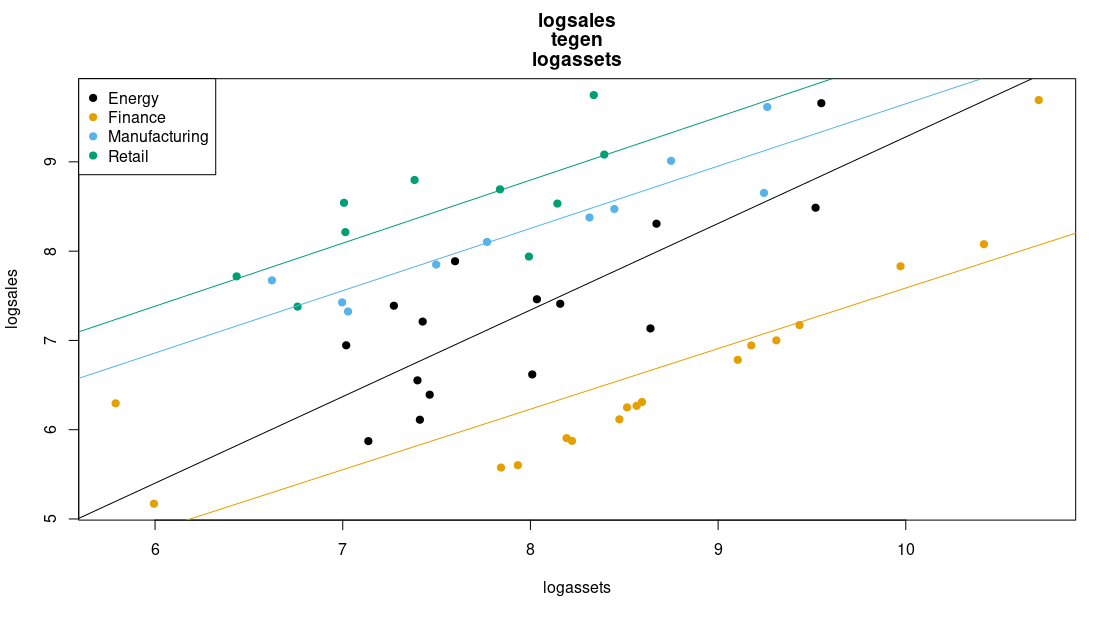
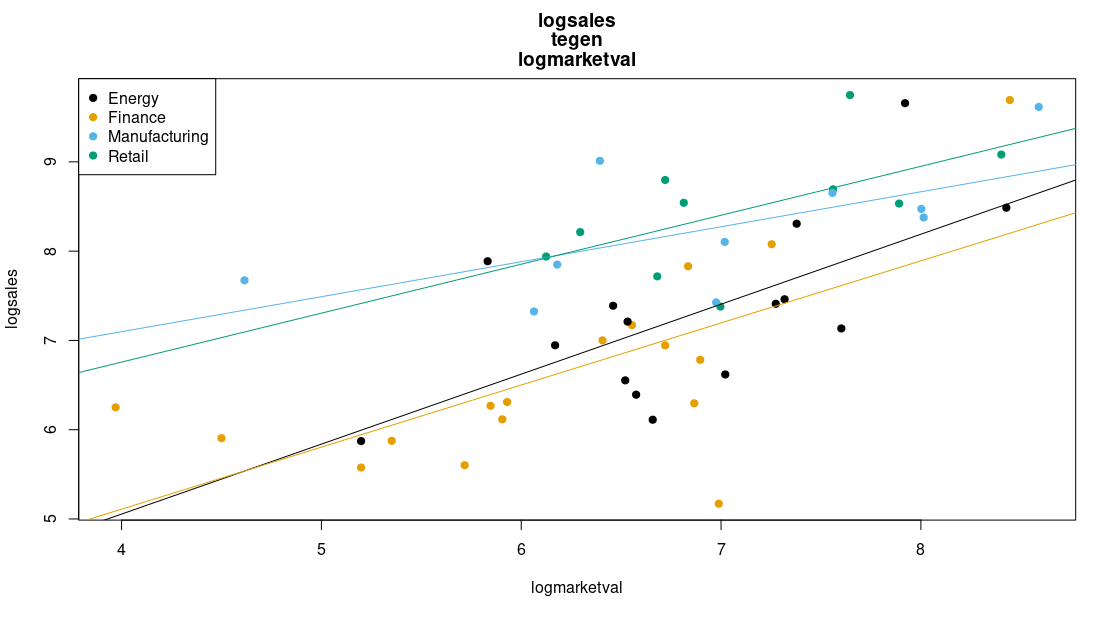
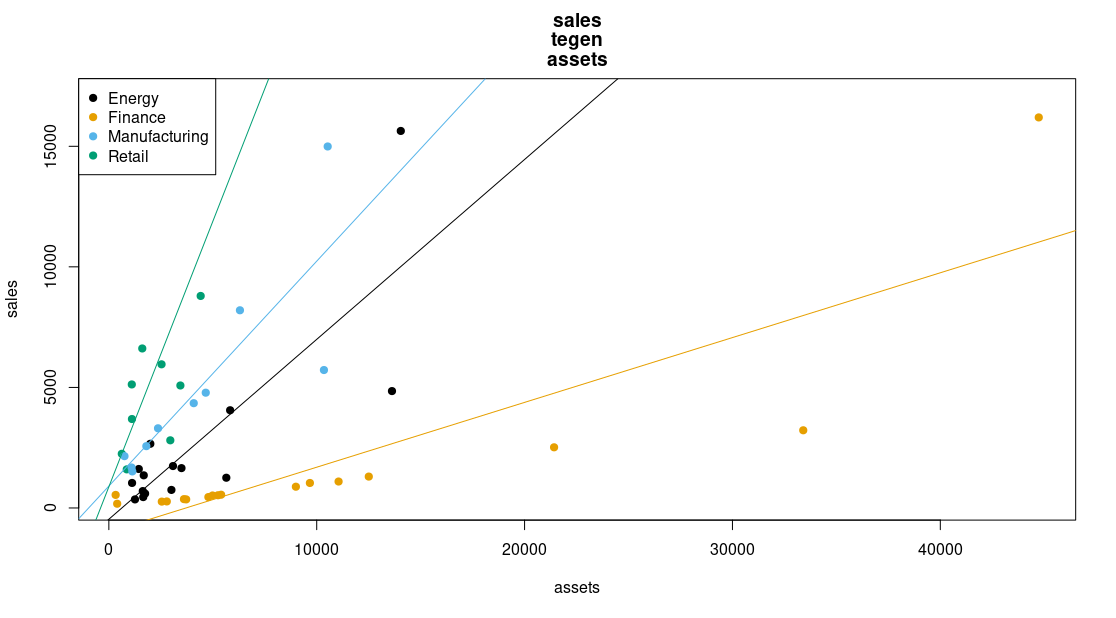
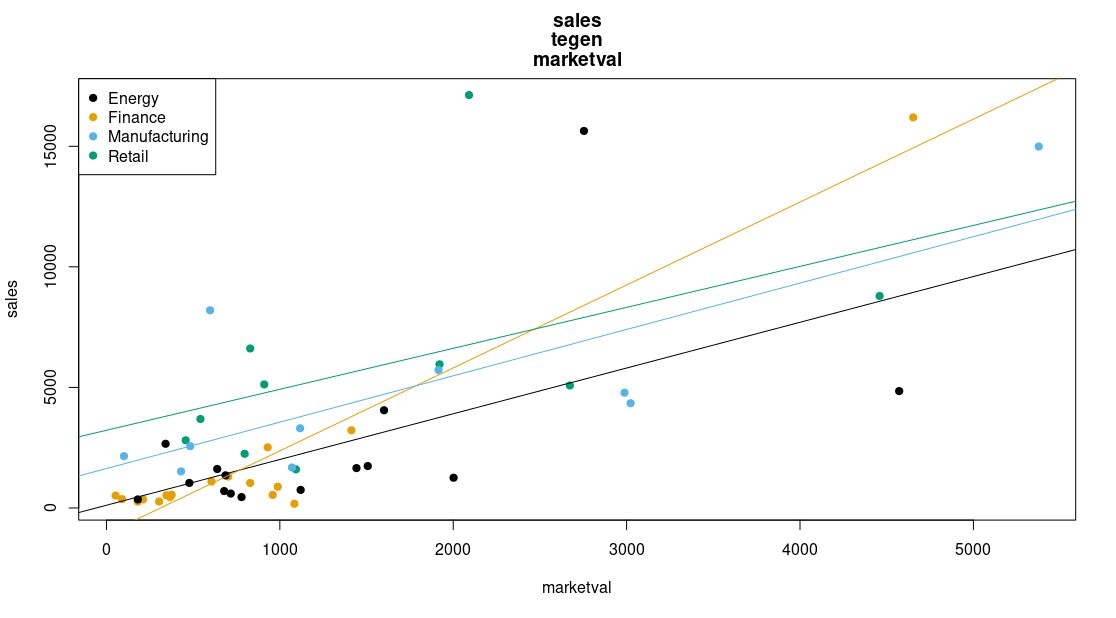
It is an analysis of a subset of 52 datapoints from the forbes500 dataset of 1986. Each datapoint consists of 4 “features”:
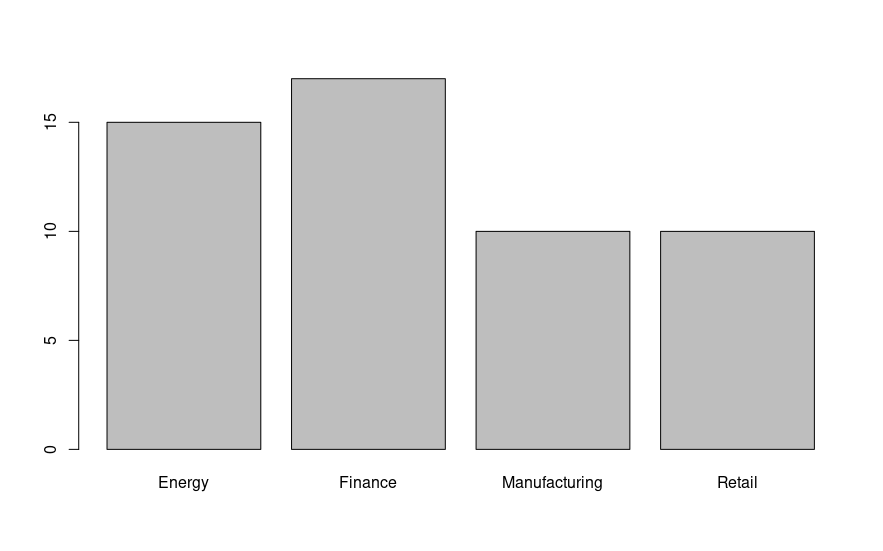
- sector (categorical, 4 levels: “Finance”, “Energy”, “Manufacturing”, “Retail”)
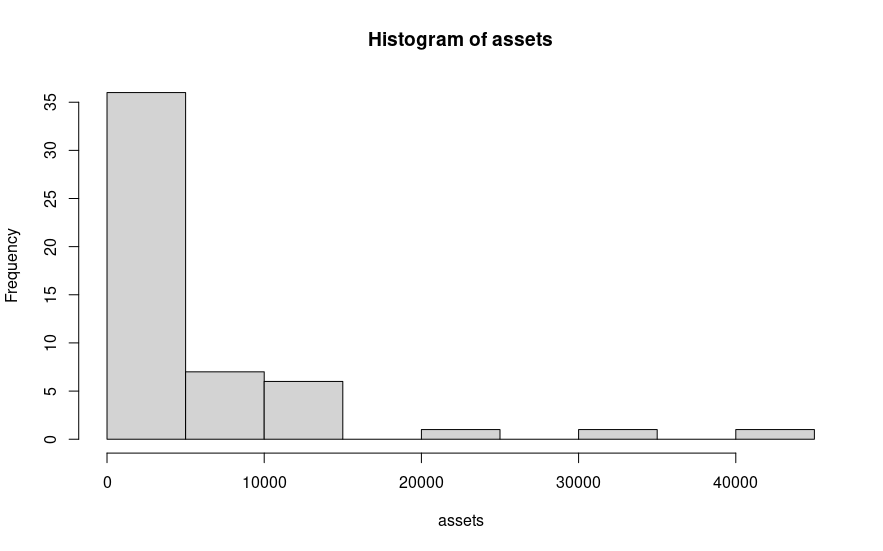
- assets value
- annual sales
- market value
The goal is to explain the market value with assets, sales and sector using a multiple linear regression (MLR) model. We are free to include or exclude any of the given covariates and create interactions. We need, however, to motivate modelling decisions by showing test results or relevant statistics. So, many $t$-tests, $F$-tests and ANOVA-tables follow. I also went into some model selection theory, showing what biases might arise when we estimate a too restricted model, or how the variance will increase if we estimate a too unrestricted model.
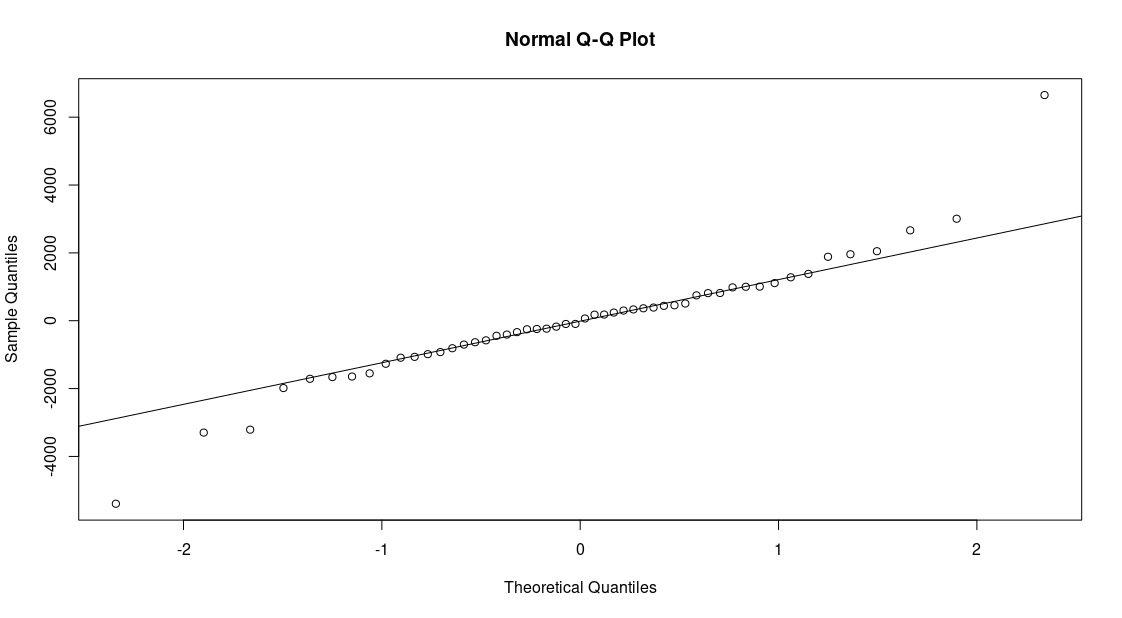
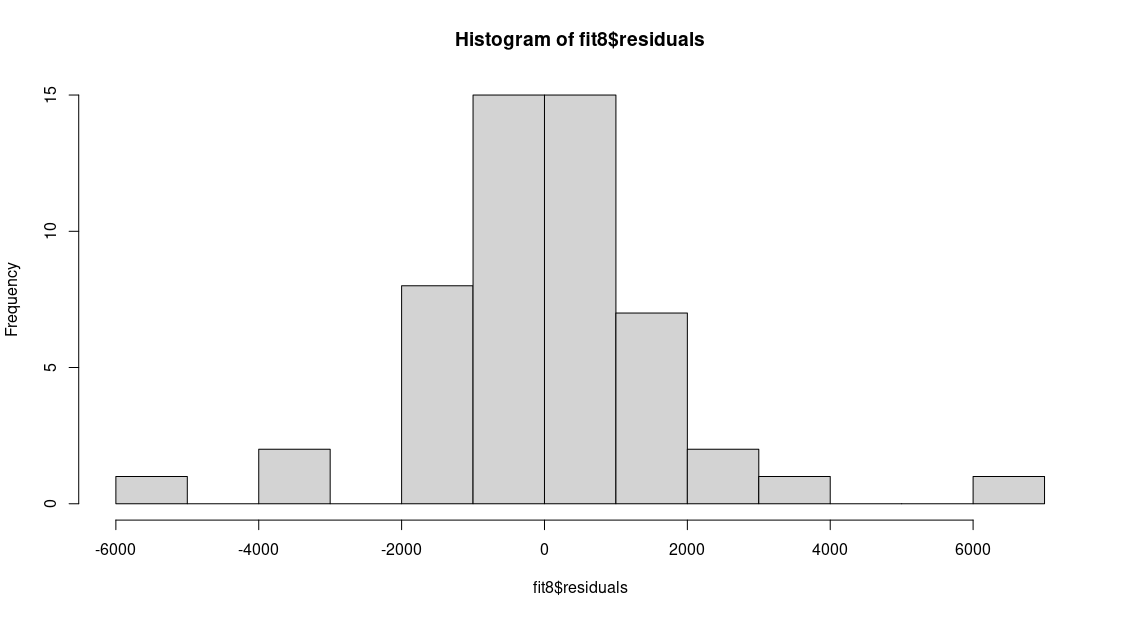
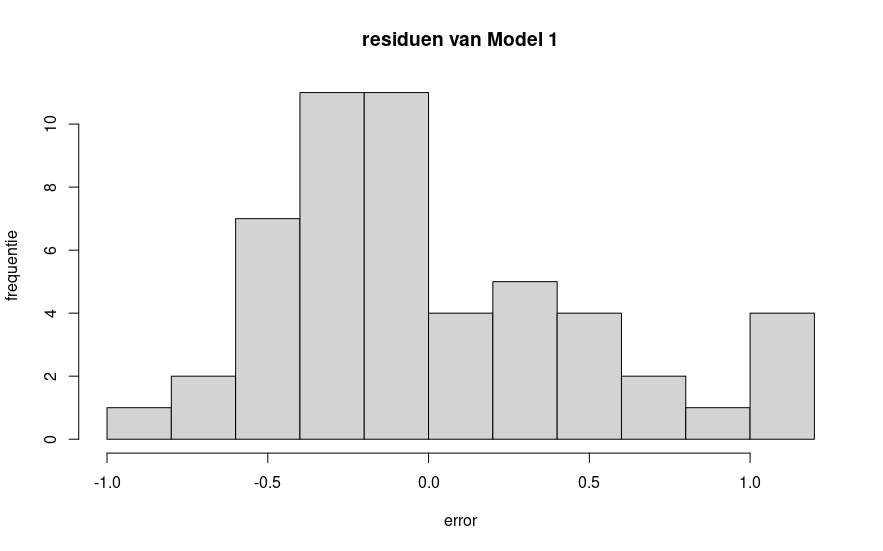
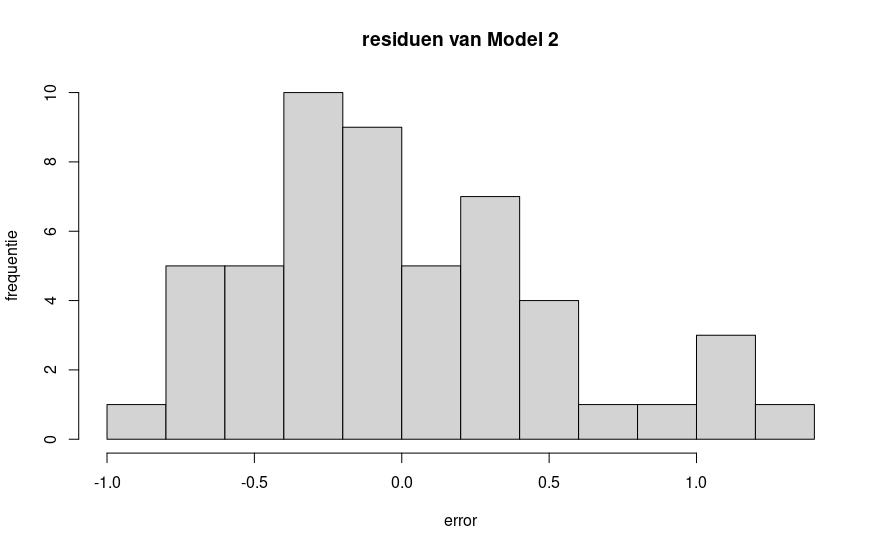
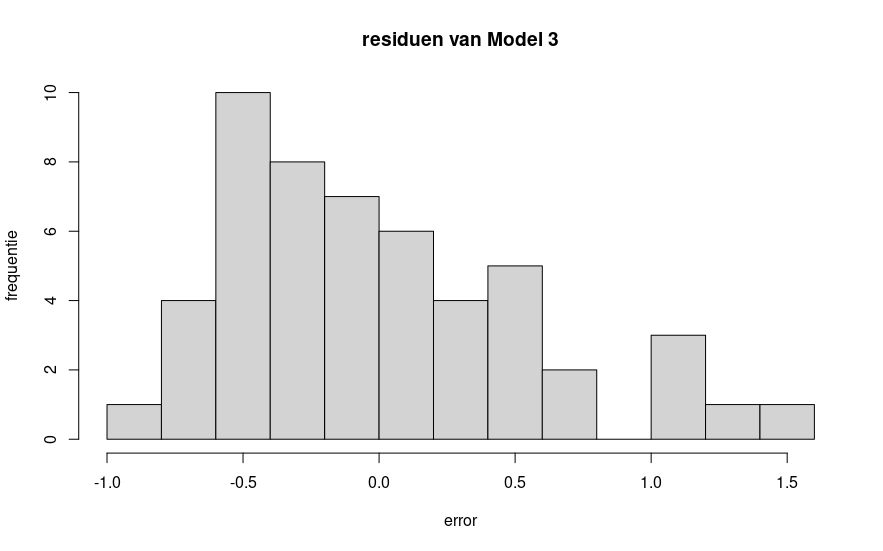
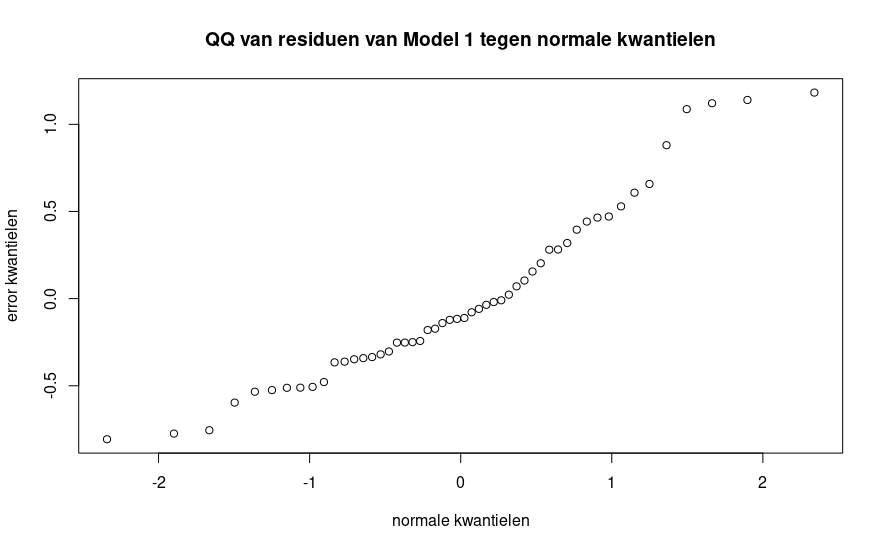
To investigate whether the variance of residuals might better be estimated per sector (i.e. the variability around the model prediction is dependent on the sector in which we make the prediction), we received a hint at a new test statistic which we may wanted to try out ourselves. The null-distribution of the statistic was unknown, as was it unknown whether the statistic was actually pivotal. The report (chapter 5) also features a derivation of this fact. Then, a simulation of the null-distribution and the strong conclusion that residual variance is different among different sectors.
What you’ll Find in the Repo
The assignment is available both in Dutch as Statistiek Opdracht (Dutch).pdf and in English as Statistics Assigment (English).pdf. Note that DeepL did a poor job a translating the formulas from the original Dutch assignment statement, for that I recommend just looking up the formula in the original.
All scripts I used for this project were put naively into one big .R file, R_Script_Regression_Analysis.R. Had I known that I would at a later time want to display this project, I would certainly have thought better of separating unrelated scripts into separate files. Refactoring this rather old project is however not my top priority right now. I would rather spend my time learning some new interesting topics in regression analysis and general statistics.
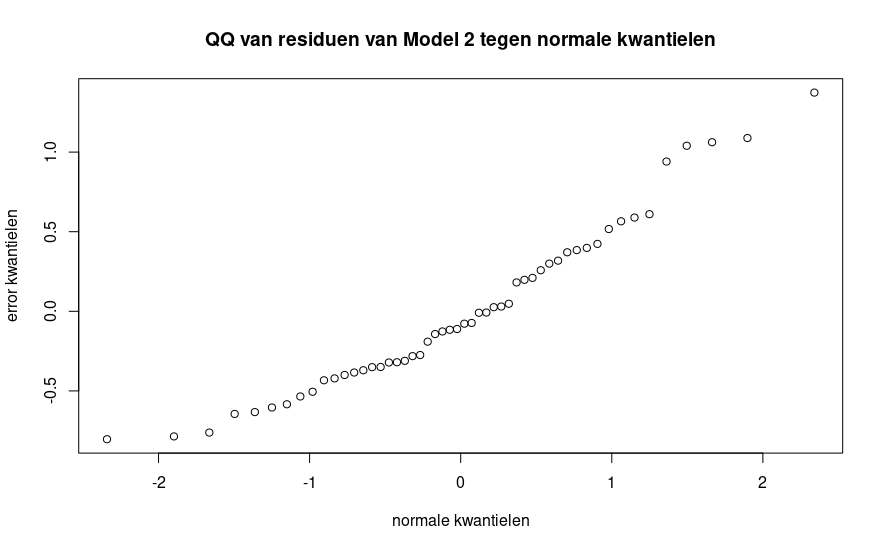
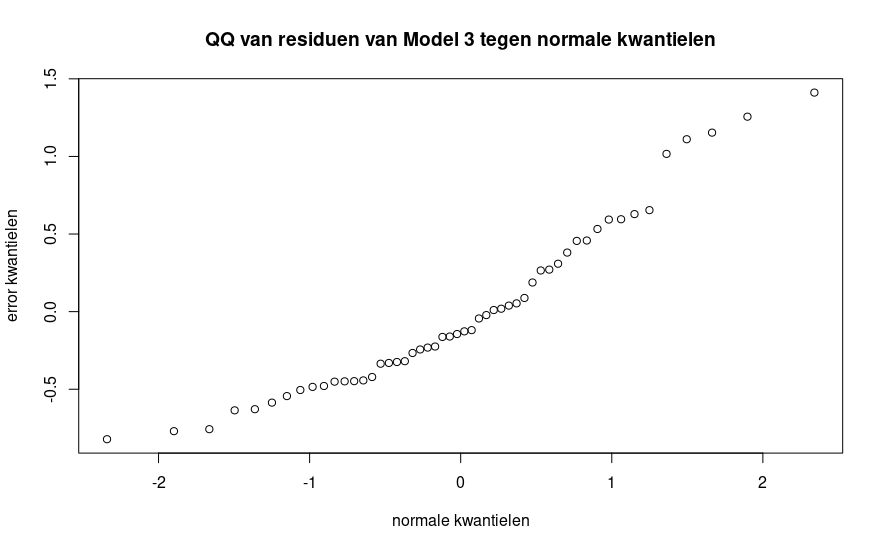
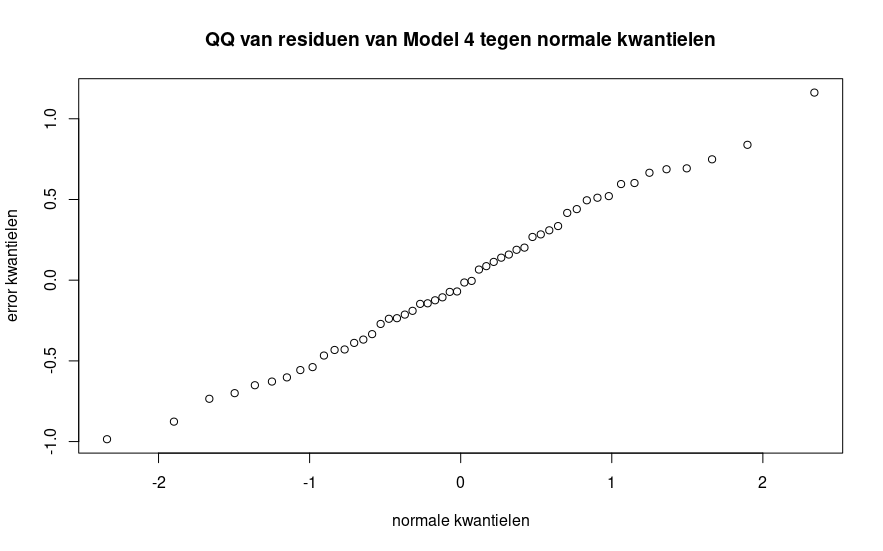
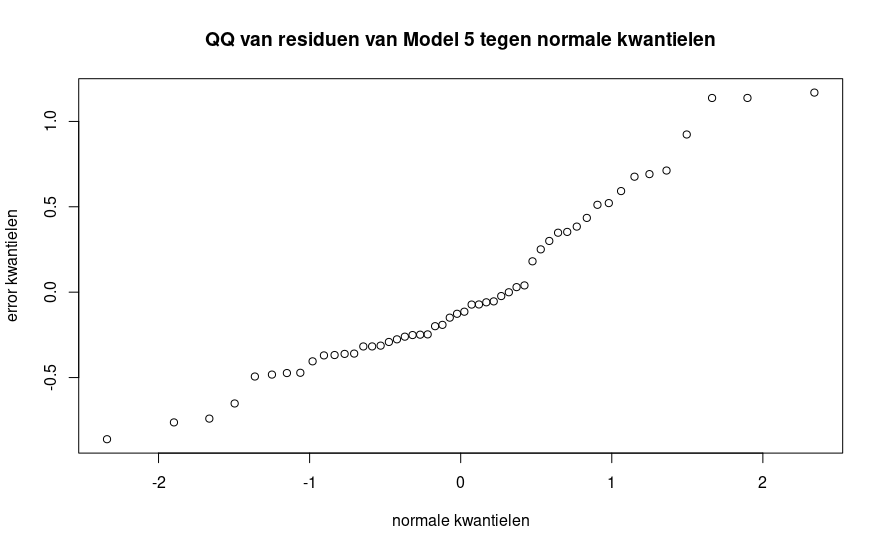
The report, written in Dutch (and not to be translated any time soon) is also in the top-level directory, in Regression Analysis Final Version.pdf. For any non-Dutch reader, I think the report is sprinkled so generously with relevant tables, plots and histograms that it creates its own visual story. You may even be able to infer from the context what is written there in Dutch. In general, I invite you to open it and have a scroll through it, it’s very pleasant to the eye!
The images, draft versions and all other .tex/.log/.aux/.toc clutter can be found in the
imgandtexsrcfolders, respectively.
Gallery